
Utility Solar and Energy Storage Market Update
Victor Phan, 28 February 2022
Q4 2021 UTILITY-SCALE SOLAR MARKET UPDATE1
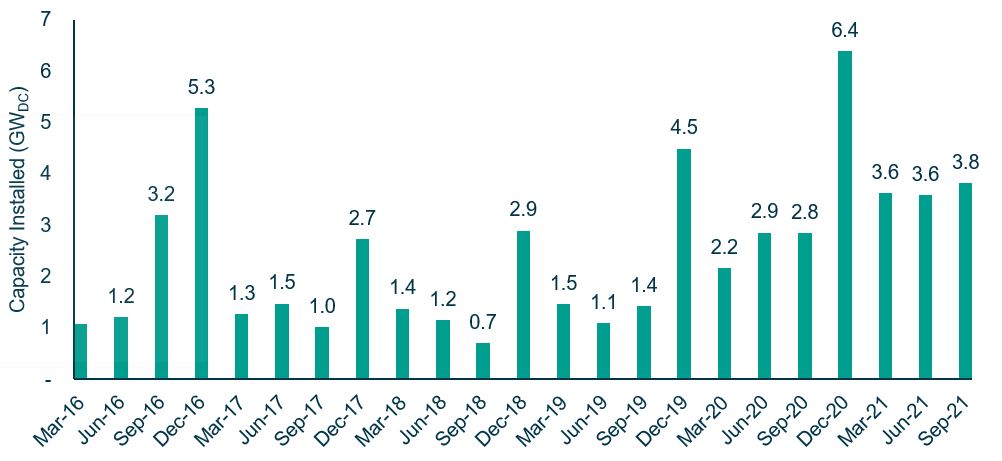
Over the course of Q3 2021, 5.4GWDC of solar capacity was installed. This brings the total capacity installed over the year to Q3 to 15.7GWDC, putting 2021 on track to exceed 20GWDC of installations. If Q4 2021 installations exceed 5GWDC, 2021 will be a record-breaking year. Solar PV accounted for 54% of all new electricity generating capacity additions between Q1 2021 to Q3 2021, continuing to be the largest share of new generating capacity in the US.
US utility-scale solar grew quarter over quarter and year over year in Q3 2021. Of the 5.4GWDC of US solar installed over the quarter, 3.8GWDC was US utility-scale solar. Approximately 7.5GWDC of utility-scale solar is expected to come online in Q4 2021, bringing the total 2021 forecast to 20.2GWDC up 30% from 2020’s 14.3GWDC of installations. The 3.8GWDC of utility scale solar installed over the quarter represents:
- a 34% increase compared to Q3 2020;
- a 20% increase compared to Q3 five years prior; and
- the largest third quarter for US utility-scale PV ever recorded.
Figure 1: US utility-scale PV capacity installed by quarter
Approximately 6.1GWDC of new contracts were signed in Q3 2021, pushing the total contracted pipeline to 81GWDC. There are currently 22.3GWDC of utility scale projects currently under construction. Wood Mackenzie have decreased their 2022 forecast of utility-scale solar installations by 7.5GWDC (33%) due to challenges around commodity prices and supply chain constraints, which are expected to last until early 2023. Despite these headwinds, Wood Mackenzie still expects approximately 122GWDC of solar to be installed between 2021 and 2026 as seen below, with further scope to grow if portions of the Build Back Better Act come to fruition.
Figure 2: US utility-scale PV capacity installed and forecasted by year

The Build Back Better (BBB) Act had exciting momentum last autumn, but one Democratic Senator (Manchin of West Virginia) blocked it. While the Act in its current form is unlikely to go ahead, Manchin and the Biden Administration have both suggested that components of it, namely climate and clean energy programs, may be the most likely to move ahead. Manchin said in early January that it would be easier to pass $500 billion in climate provisions as a standalone bill and has suggested he would support clean energy tax credits.2
It is difficult to say what is likely to be put forth in any new legislation or climate efforts, but we can look to what was included in the original Act, like extensions and modifications to the Investment Tax Credit (ITC) for solar as a guide. Wood Mackenzie has forecasted that the current ITC extension terms would boost solar capacity by 31% in the next five years (43.5GWDC), with most of this coming from utility-scale solar. The ITC extension would continue to drive the economic competitiveness of solar and partially offset the price increases the industry has seen due to supply chain constraints.
The proposed extension and expansion of tax credits in the current BBB Act allows solar developers to have a wider scope in applying those credits. Utility scale solar projects can continue to receive the ITC at a rate of 30% (assuming certain conditions are met) or opt for a production tax credit (PTC) at $25/MWh (if they meet certain requirements and opt to do so, an option that was previously exclusive to wind installations only). The current ITC provides a fixed tax rebate to the investor once the project is placed in service, whereas a PTC is a variable tax rebate linked to the production throughout the first 10 years of a project’s life. In addition to the ITC and PTC, developers will also have the option to receive direct payment in lieu of tax credits, potentially removing the need for tax equity investors and providing developers with greater incentive around project economics.
Q4 2021 ENERGY STORAGE MARKET UPDATE3
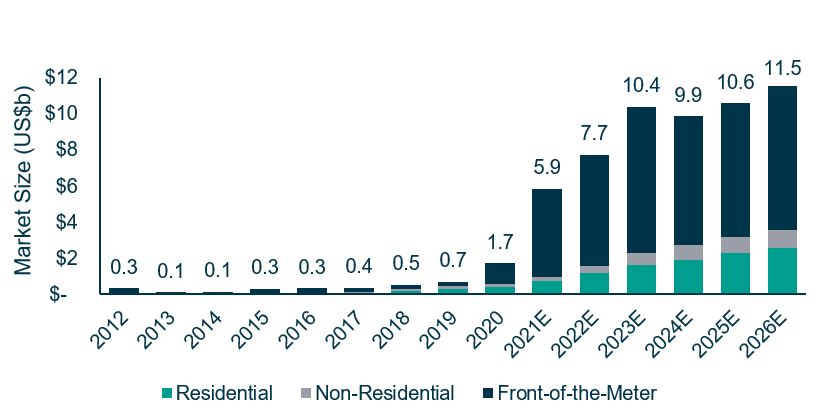
In Q3 2021, there was a record breaking 3,515MWh of US energy storage installed, breaking the previous quarterly record by 87% set in Q4 2020. The majority of US energy storage installations are driven by the front-of-the-meter (commercial) market (3,198MWh in Q3), followed by residential (230MWh) then non-residential energy storage markets (92MWh). The large increase in installations over the quarter is due to increased deployments in states with longer average durations such as California. The final quarter for 2021 is expected to triple the amount of installations in Q3 2021, which in turn would see 2021 would see a 6x increase over 2020 installs on a MWh basis. By 2026 the annual market value of the US energy storage market is expected to surpass US$11.5b through accelerated growth and rising installations as seen below.
Figure 3: US annual energy storage market size, 2018-2026
Battery storage opportunities continue to evolve; interconnection with the grid is a key advantage and provides an opportunity to deploy battery storage retrofit solutions. Given the complexity of the various interconnections and legislative hurdles, assessing viability across regions and states in the US may require engaging consultants. For example, in California, understanding deliverability is critical. Deliverability is required for a battery storage project to qualify for Resource Adequacy and ancillary service revenue streams. Without deliverability, a solar project can host a battery storage project and contract with the offtaker to shift load (e.g. day charge, evening discharge). However, the intraday pricing differential needs to be sufficient to substantiate a reasonable PPA price / revenue structure to support the project. USF is working with the appropriate experts to understand the cost and benefits of retrofitting storage on its existing portfolio.
1 Wood Mackenzie / SEIA Q4 2021 U.S. Solar Market Insight®. The Q4 2021 report provides data through Q3 2021.
2 https://www.eenews.net/articles/its-manchins-climate-bill-now-heres-what-might-be-in-it/
3 Wood Mackenzie / SEIA Q4 2021 U.S. Energy Storage Monitor®. The Q4 2021 report provides data through Q3 2021.